Report Generation For Planning
UX Sample
Introduction
The Planning application by Campus Labs required a rebuild of the experience for users to generate reports on their data. The entire user experience was rebuilt from the ground up with the purpose of updating the visual appearance to match the modern look and feel of the overall Planning application; as well as attempting to create an easy to use report configuration experience.
Work samples displayed here include: the main report configuration screen, examples of filtering a generated report, and report print options settings.
Lastly, also included here, are three studies of how a user can select what fields from a selected data set to include in their reporting. These are presented in (2) online clickable prototypes.
Roles performed:
-
User research and requirements gathering to identify key areas requiring enhanced improvements
-
User experience design
-
Multiple usability tests with member campus’s
-
Iterative design prototypes to drive towards optimal user experience
Report Generation Builder
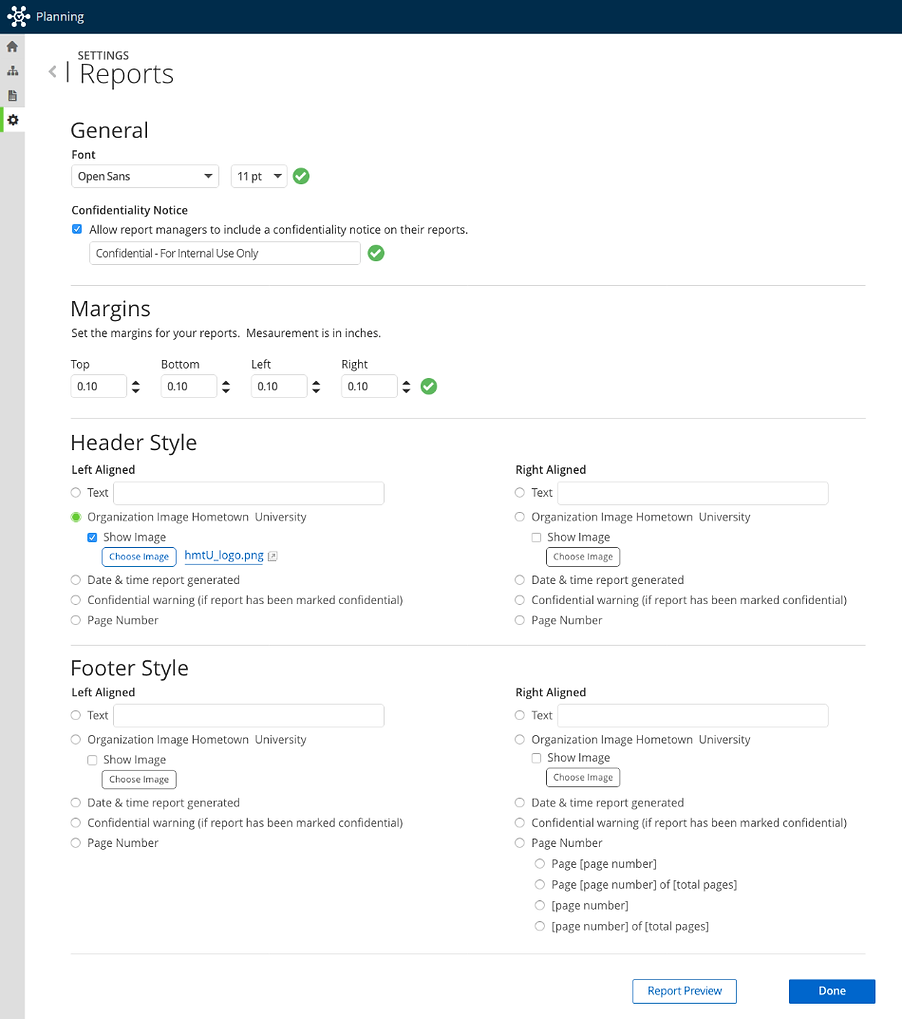
Screen below presents the report builder screen in "Planning".

Report Filtering
Users are able to apply filters to the generated report.
Goal was to make the filtering experience very much like using a shopping experience model.

Report Sharing
Users are able to share web based reports to others users.
Sharing reports is made simple and intuitive. Quick and Easy!

Adding Fields For Inclusion in the Filter: (3) Variations
For the Report Configuration experience below are (3) variations on a user experience for adding field elements to the report.
Click the label above each image for an interactive prototype.
The orange circle indicate what element is clickable.
Version presents all available fields to the user. The user then selects the desired fields which are then included in report generation.

Version in which the user adds the desired fields from a drop down control.

Version is modeled after a traditional "add/remove" control. All available fields are presented to the user and they add the desired fields which are moved to the "included" column on the right.
